


The Simulator
PeerfactSim.KOM is a flexible and mature event-based simulator written in Java. The events follow a timeline which assures sequential processing. Events are part of so-called operations, which are generated either through the entities in the simulation or through an external actions file. Such an operation is for example a lookup in a DHT. Operations help to trace actions on every layer, allowing the protocols to store local state information easily and to react on operation timeouts. Operations on various layers are decoupled which allows for the combined simulation and evaluation of various protocols in parallel.
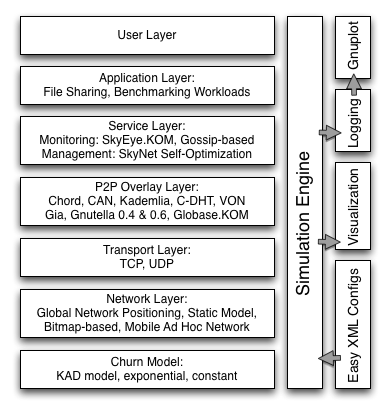
The functional layers
The user layer can be used to define strategies of various user types that are performed on the application layer.
The application layer defines the application logic and its characteristics, such as file sharing with typical Zipf-distributed request patterns.
Various advanced protocols are covered in the service layer. Management and control mechanisms for example use system aggregation monitors to constantly optimize the p2p system configuration. Such services are neither part of the application nor the p2p overlay. The service layer functions use the p2p overlay interfaces in order to provide general functional offers that improve the quality of the p2p application or create a reusable functional building block for various p2p applications.
The p2p overlay layer covers structured (Chord, Re-Chord, Kademlia, Pastry, Globase), unstructured (GIA, Gnutella 0.4, Gnutella 0.6, Napster) and information dissemination (VON, pSense, Mercury) p2p overlays with corresponding interfaces (e.g. the Key-based Routing API).
The transport layer serializes messages and offers TCP and UDP as implemented protocols, which can be used in combination with the network layer to obtain realistic values for throughput, delay, jitter, loss and peer positioning. The network layer implements besides static and simple network models also advanced models, like Global Network Positioning (GNP) based on measurements from the PingER project. This network model allows to run simulations based on realistic modules based on measurements.
The churn models that can be activated for time intervals are either based on measurements (in KAD) or implement popular churn behavior (exponential).
The simulations are conducted by the simulation event queue, which manages and schedules events in the simulation. Every event is processed at it scheduled time and logged for further analysis.
The logging is twofold. First, a history of relevant events is stored for a later visualization. Second, a layer-wise protocol of the events is captured by analyzers creating simulation statistic files which can be directly fed into gnuplot. Thus, the simulator helps to easily create plotted results.
The workflow of a simulation
The workflow with the simulator is very simple. An XML-based configuration file is used to specify which implementations and configurations on which layers are to be used. The configuration file further specifies an action file, which contains the operations that are to be started by specific peers at specific time intervals.
Once, the configuration is completed, the user may start a GUI to choose the configuration file and to observe the simulation status. If a visualization module was chosen, the traffic and recorded statistics over the simulation time may be observed, once the simulation finished. Examples of this visualization is given in on the screenshot page.
Independent of running simulations visualized or headless, the plotable simulation statistics are automatically generated.